Broker Check
Weekly Update: Market Concentration

Weekly Update: Market Concentration

January 20, 2026


Weekly Market Update
January 20, 2026
Outlook


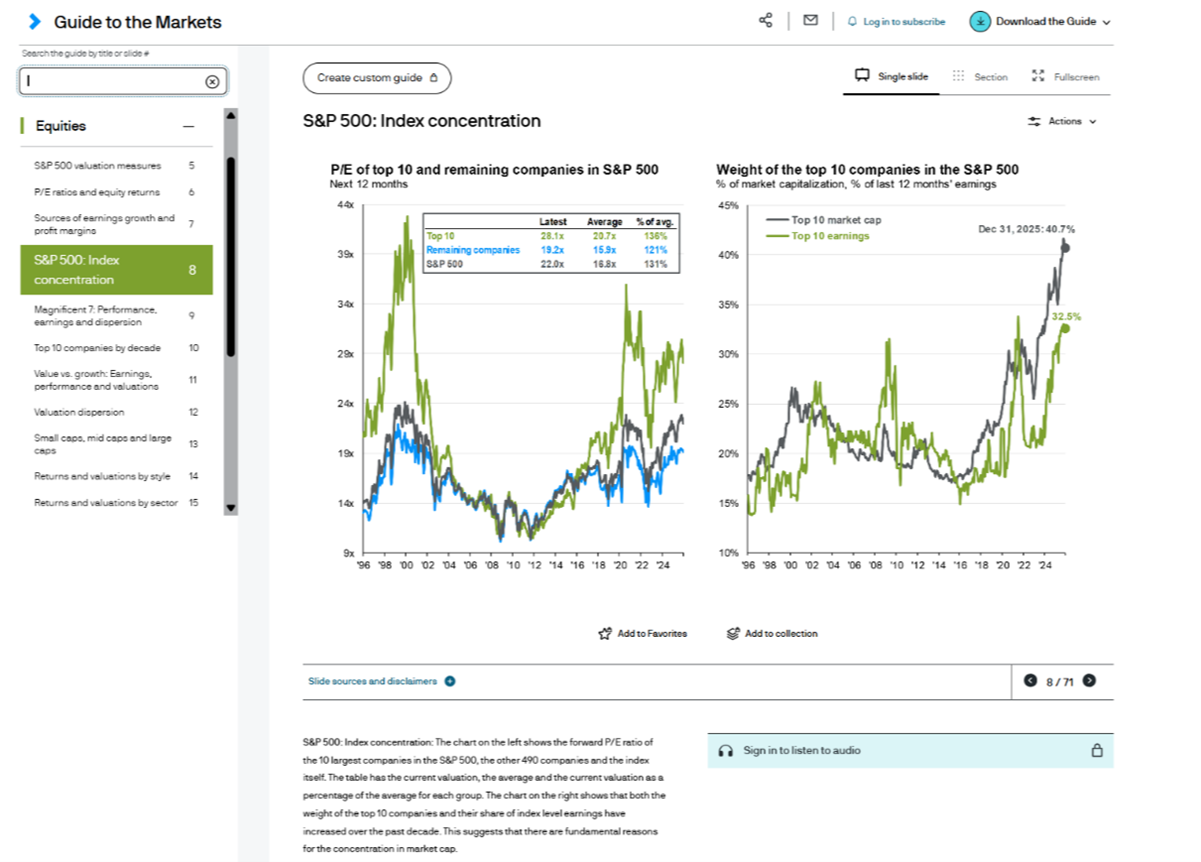
By the end of 2025, the 10 largest companies in the S&P 500 Index represented 41% of its total size in terms of market capitalization (price times total shares outstanding for each company) - slightly below all-time-high levels reached earlier in late-2025.1 Further, the earnings for these 10 companies reached a historically high 33% (slightly less than its all-time high in 2021). This is all to say that in 2025, the largest companies in the Index were historically large in terms of market valuation and the sheer dollar amount of profits these businesses earned.

While this does not present any conclusive forecast about what 2026 will bring for the largest companies in the S&P 500, historic peaks suggest caution - at least as it relates to market capitalization peaks, which occurred in the 2000, 2008, and 2021 time-frames which coincided with bear markets. On the other hand, when the largest companies simply earned a lot of profits, specifically periods of peak profits relative to the overall S&P 500, subsequent index returns results were generally better --- such as the 2002-2003 time frame when profits peaked and the recovery from the dot-com bust gathered steam.

As a result, today's situation is a bit uncertain for the largest companies. However, the excess valuation peak vs. profits (41% vs. 33%) may imply that some caution is worthwhile. Either way, we find 2026 as a good time to consider rebalancing out of overweight positions residing in the top 10 spots of the index.

. . .

U.S. equities ended last week navigating a mix of geopolitical tensions, policy headlines, economic data releases, and early-season corporate earnings, yet markets continued to demonstrate notable resilience.

CPI Data: Inflation Trends and Market Implications 

The latest CPI report showed inflation broadly aligned with expectations. Headline CPI rose 0.3% in December and 2.7% year over year, while core CPI increased 0.2% on the month and 2.6% annually, coming in slightly cooler than forecast.2 This affirmed the ongoing narrative of gradual disinflation, even as inflation remains above the Federal Reserve’s 2.0% long run target.

Markets interpreted the data as consistent with a continued easing in price pressures, but not decisive enough to meaningfully alter near term monetary policy expectations. The futures market maintained the view that the Federal Reserve is likely to keep rates on hold at its upcoming meeting, with any potential rate cuts likely deferred until mid year.3

Overall, the path back toward the Fed’s inflation target is expected to remain uneven, and policymakers will likely require sustained evidence of cooling before shifting their stance.

Corporate Earnings: Financials 

Major U.S. banks delivered generally solid fourth-quarter results, supported by resilient loan growth, improved net interest income, and stable credit quality across consumer businesses.4

Banks benefited from a meaningful rebound in investment banking activity, with dealmaking and capital markets revenues strengthening, while trading desks saw heightened activity amid persistent market volatility. Despite overall healthy results, bank stocks slipped as executives highlighted potential headwinds—including the administration’s proposed 10% one year cap on credit card interest rates, which banks warned could pressure lending economics.

Even so, the broader earnings landscape remained supportive. Expectations for continued corporate spending, along with healthy operating fundamentals, helped reinforce confidence in long term equity positioning.

Overall, while geopolitical and policy uncertainties will likely continue to generate noise, the market's muted reaction suggests that investors currently view these risks as secondary to the more durable economic and corporate trends (moderating inflation, steady earnings momentum, and a resilient economy) that remain broadly encouraging heading into the next phase of 2026.

[1]  https://am.jpmorgan.com/us/en/asset-management/adv/insights/market-insights/guide-to-the-markets/

[2]  Consumer Price Index - December 2025

[3]  FedWatch - CME Group

[4]  Bank Earnings Surge as Wall Street Bets on a Broad Earnings Rally - Barron's

Market Performance Stats


Upcoming Reports

Monday: Holiday - Markets closed

Tuesday: ADP Employment Change Weekly

Wednesday: U.S. President Trump Speaks, Construction Spending, Pending Home Sales 

Thursday: PCE Price Index, GDP (Q3)

Friday: Manufacturing and Services PMI, Michigan Consumer Sentiment and Expectations


Aviance Capital Partnersis a Naples, FL-based registered investment advisor with advisors in Naples and Orlando. We provide professional wealth management,financial planning, and investment strategiessince 2009. Our financial advisors are fiduciaries, offering services such as retirement income planning, tax-efficient investing, and customized portfolio management, all designed to help clients achieve their long-term financial goals.

Whether you're preparing for retirement or seeking a tailored investment management strategy,Aviance’s wealth advisorsin Naples and wealth advisors in Orlando provide financial planning and investment management services to investors in all of Florida and beyond.

Thank you for reading. If you have any questions or concerns, or would like to speak with a member of our team, please click the button below to reach out to us. We would love to hear from you!

Aviance Capital Partners
fbintw
Disclosures: Aviance Capital Partners, LLC (“ACP”) is an SEC registered investment adviser located in Naples, Florida. Registration as an investment adviser is not an endorsement by securities regulators and does not imply that ACP has attained a certain level of skill, training, or ability. While information presented is believed to be factual and up-to-date, ACP does not guarantee its accuracy and it should not be regarded as a complete analysis of the subjects discussed. All expressions of opinion reflect the judgment of the authors as of the date of publication and are subject to change. Not all services will be appropriate or necessary for all clients, and the potential value and benefit of the ACP’s services will vary based upon the client’s individual investment, financial, and tax circumstances. The effectiveness and potential success of a tax strategy, investment strategy, and financial plan depends on a variety of factors, including but not limited to the manner and timing of implementation, coordination with the client and the client’s other engaged professionals, and market conditions. This should not be construed as specific investment, financial planning or tax advice tailored to an individual reader. ACP suggests that readers consult a financial professional, attorney or tax advisory professional about their specific financial, legal or tax situation. Past performance does not guarantee future results. All investment strategies have the potential for profit or loss, and different investments and types of investments involve varying degrees of risk. There can be no assurance that the future performance of any specific investment or investment strategy, including those undertaken or recommended by ACP, will be profitable or equal any historical performance level. The index and sector performance data appearing or referenced above has been compiled by the respective copyright holders, trademark holders, or publication/distribution right owners. Historical performance results for investment indexes or sectors represented are for illustrative purposes only and do not represent actual portfolio performance. The indexes or sectors represented generally do not reflect the deduction of transaction and custodial charges, or the deduction of an investment-management fee, which would decrease historical performance results. Investors cannot invest directly in an index. ACP makes no warranty, express or implied, for any decision taken by any party in reliance upon such index information.

The S&P 500 is the Standard & Poor’s index calculated on a total return basis. Widely regarded as the benchmark gauge of the U.S. equities market, this index includes a representative sample of 500 leading companies in leading industries of the U.S. economy. Although the S&P 500 focuses on the large-cap segment of the market, with over 80% coverage of U.S. equities, it also serves as a proxy for the total market. The Dow Jones is a price-weighted market index that tracks 30 large, blue-chip companies. The NASDAQ is the second-largest stock and securities exchange and attracts more technology-focused or growth-oriented companies. The Russell 2000 Index is a small-cap stock market index that makes up the smallest 2,000 stocks in the Russell 3000 Index. The Russell 1000 Index is a subset of the larger Russell 3000 Index and represents the 1,000 top companies by market capitalization. Bond Aggregate is represented by the iShares Core U.S. Aggregate Bond ETF.

All “expectations, forecasts, consensus, or estimates” are based on Bloomberg unless otherwise specified.

Additional information about ACP, including its Form ADV Part 2A describing its services, fees, and applicable conflicts of interest and its Form CRS is available upon request and at https://adviserinfo.sec.gov/firm/summary/146597. For current ACP clients, please advise us promptly in writing, if there are ever any changes in your financial situation or investment objectives, if you wish to impose any reasonable restrictions to our management of your account, or if you have not been receiving at least quarterly account statements from your account custodian.

This material was developed and produced by FMG Suite to provide information on a topic that may be of interest. FMG Suite is not affiliated with the named broker-dealer, state- or SEC-registered investment advisory firm.