Outlook Generally speaking, bonds have two types of risk. One related to interest rates. When rates go up, bond prices go down. The second primary risk relates to credit quality. When a bond has a risk of default, no matter how likely or unlikely, its price generally declines as default risks increase (either of the bond itself or more defaults are occurring in the bond market or economy). The trade-off (or benefit) of investing in bonds with more interest-rate risk or credit risk is that these bonds generally have a higher rate of income (yield). In other words, if you buy bonds with longer maturities or lower credit ratings, you should expect a better yield. The broad bond market, as measured by the Bloomberg Aggregate Bond Index (the Agg), consists of short, medium, and long-term bonds of various credit ratings. As a result, the Agg will have more interest rate and credit risk than Treasury Bills (T-bills), which are backed by the full faith of the U.S. government and have a very low-interest rate risk. However, since the earlier part of 2023, T-bills (as measured by the exchange-traded fund "BIL") have had a better yield than the Agg (as measured by the exchange-traded fund "AGG"). So, for the past two-and-one-half years, investors have enjoyed much lower risk for a better rate of income. This is a relationship that, in theory, should not last forever. In fact, the yield advantage of T-bills has been shrinking from a high of approximately 1.8% to less than 0.3% currently.1 It is reasonable for broad bond market yields to exceed those of lower-risk treasury relatively soon. Although our comparison is simply looking at the dividend yields of one fund vs. another, it is perhaps an indicator that investors of ultrashort-term bond investments may soon elect to step out a bit on the maturity and or credit spectrum in search of better yields.
. . .
The markets reacted positively to the Fed’s interest rate decision and commentary on the economy and policy outlook, along with news of resuming Treasury Bill purchases to support liquidity in short-term money markets. The central bank concluded the final meeting of the year by delivering a third straight 25 basis-point (0.25%) cut to the federal funds policy rate, which was widely anticipated, and announced updated projections for economic indicators and the policy outlook.2 The vote, as anticipated, was far from united. Two FOMC members, Jeffrey Schmid (President of the Kansas City Fed) and Austan Goolsbee (President of the Chicago Fed), expressed concern over elevated inflation and voted against a rate cut. Whereas, Stephen Miran (Fed governor) supported a steeper cut of 50 bps (0.50%). Despite the three opposing votes, the majority (nine others) voted in favor of a 25 basis-point reduction, citing concerns over weakness in the labor market. Hiring, as shown in the ADP data and nonfarm payrolls revisions, has slowed in 20253, while employment, as shown in initial and continuing jobless claims, has increased in 20254. This, accompanied by a loss of quality Federal data during the government shutdown, led policymakers to justify voting for another rate cut to protect against risks of further softening in the labor market. Fed Chairman Jerome Powell took a cautious stance in his press conference, indicating the decision was a “close call” and that the central bank is “well positioned to determine the extent and timing of additional adjustments based on the incoming data, the evolving outlook of the balance of risks.”5 Powell’s comments and subtle changes to the FOMC press statement suggest the central bank is preparing to pause its easing cycle. 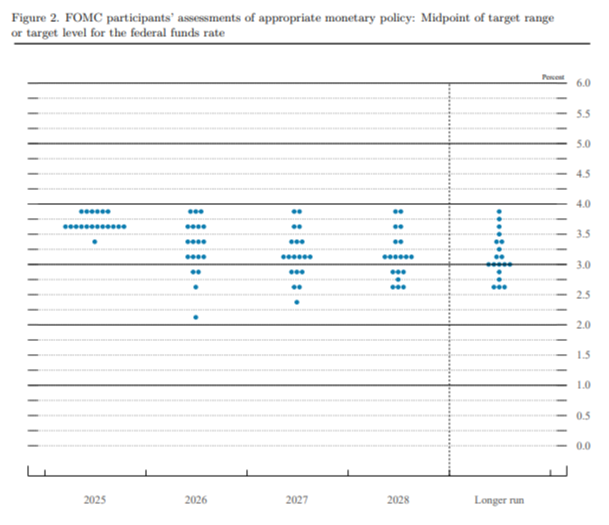
The central bank’s “dot plot” projections, which anonymously illustrate members' expectations, shows the key policy rate at 3.4% in 2026 and 3.1% in 2027, indicating a quarter of a percentage point cut each year. The forecasts mimic the projections from last quarter’s update. The outlook would bring the key policy rate to a neutral range of 3.00 – 3.25%, where it is expected to remain unchanged in 2028, according to the dot plot. The economic outlook showed members lowered their expectations for interest rates, suggesting the upward inflationary pressures from tariffs will likely be temporary. The dot plot shows a gradual decline in inflation closer to the Fed’s long-term target of 2.0%, with the personal consumption expenditures (PCE) inflation index declining to 2.9% at the end of 2025 and 2.4% at the end of 2026. The committee also gained optimism on economic growth, slightly raising expectations from the prior release. In addition to the rate reduction and forecast updates, the central bank announced plans to resume Treasury Bill purchases, starting around $40 billion each month until April, to support liquidity in money markets. Powell and other officials implied these efforts are a technical adjustment, not a shift in monetary policy, although some investors believe the effect will likely resemble similar results to quantitative easing. Traditional quantitative easing involves large purchases of longer-maturity securities, with the aim of lowering long-term yields and stimulating economic activity. Whereas the current plan focuses on short-term treasury bills to increase system reserves, ease borrowing conditions/costs, increase market stability, and gain control of short-term interest rates. For Treasury bill yields specifically, it is likely the Fed’s purchasing program will place downward pressure on short-term yields, all else equal. Therefore, given the current backdrop, we foresee returns on cash equivalent or ultra-short bond investments such as money market funds, CDs, and Treasury Bills continuing to move lower in the year ahead. If longer-term yields remain stable and elevated, this could potentially steepen the yield curve. As addressed in the outlook, perhaps incentivizing investors of such securities to step out a bit on the maturity and or on the credit spectrum in search of better yields.
[1] https://media.ycharts.com/charts/ [2] Federal Reserve issues FOMC statement [3] ADP® Employment Report [4] Continued Claims (Insured Unemployment) (CCSA) | FRED | St. Louis Fed [5] The Fed - December 9-10, 2025 FOMC Meeting |